TL;DR
- Mixed-use development analytics is about movement between uses, because a district’s value depends on whether office workers, shoppers and diners actually cross between them.
- Zone transition data shows how visitors move between retail streets, dining, plazas, office lobbies and parking-adjacent areas, which total counts on their own can’t reveal.
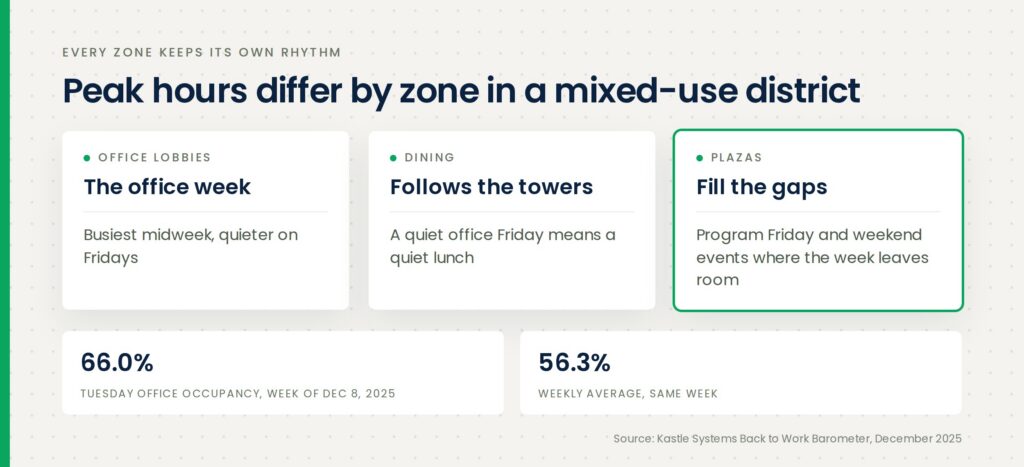
- Peak hours differ by zone in a mixed-use district, so retail, dining and public space programming work best planned around each zone’s own rhythm.
- Placemaking metrics such as plaza dwell time, weekend activity and post-event movement turn a “vibrant public realm” into something you can report to owners and tenants.
- WiFi analytics measures detectable devices in the shared areas access points cover, so it’s best read as a trend and comparison tool rather than an exact headcount.
- A branded captive portal on the public guest WiFi network builds a consented list for district events and promotions, separately from visitor measurement.
You’re exploring mixed-use development analytics because your property’s success depends on how its parts work together, which a leasing report can’t show. Each use has its own data: retail has sales reports, office has badge swipes, parking has gate counts, and none shows whether the towers’ lunchtime crowd reaches the retail street. The real question: are people moving through the place as designed? This guide covers how to zone a mixed-use district, which movement and peak-hour metrics matter, how to measure placemaking and events, and where guest WiFi fits.
Why Mixed-Use Performance Depends on Movement
Mixed-use performance depends on movement because each use is supposed to feed the others, and that only happens if people cross between them. Offices bring weekday traffic, residents keep evenings busy, and retail and dining give everyone a reason to stay.
JLL’s research describes lifestyle office markets as “mixed-use regions that have curated a self-reinforcing ecosystem of diverse high-end property types with strong amenitization and walkability”, noting that office “drives weekday foot traffic and has spillover benefits for dining and hotels” while green space and the public realm “improves dwell time” (JLL, September 2025). JLL’s press release on the report found that office properties in these districts “command a 32% rent premium over other Class A office space,” with vacancy of 12.5% compared with 22.5% for the overall office market (JLL, September 3, 2025).
Those are district-level outcomes. The question is whether that spillover happens at your property, in which zones and when. That’s where on-site measurement from tools like Aislelabs Flow AI helps.
How to Zone a Mixed-Use District
The most useful zones in a mixed-use development follow the way people use the place, not the ownership or leasing boundaries between buildings. Start with the shared public areas your guest WiFi covers, and keep the first set small enough for one slide.
| Zone | What it tells you |
| Retail streets and arcades | Footfall by hour and day, and how far people walk along the street |
| Dining clusters and food halls | Dwell time and meal-period peaks |
| Plazas, parks and public realm | Dwell, weekend use and event activity |
| Office lobbies and ground-floor common areas | Weekday arrival and lunchtime departure patterns |
| Parking-adjacent entries | Which approaches visitors use and when |
Two notes. WiFi analytics only sees areas your access points cover, so an uncovered plaza or garage won’t appear. And it detects devices with WiFi on rather than every person, so read the numbers as trends for comparing zones and periods, not headcounts.
You can also group zones. Our post on Areas explains how to report a dining precinct or whole block as one unit, which suits owners who think of “the retail podium.” For outdoor coverage, our hardware integration page lists the WiFi vendors Aislelabs works with.
Zone Transitions Show Whether the Mix Is Working
Zone transition analytics shows the share of visitors who move from one zone to another, which is the clearest single signal of whether a mixed-use district’s uses support each other. Footfall shows the place is busy. Transitions show whether it’s busy as the plan intended.
Alexander Ragonese of Edens argued in a ULI panel that the ground floor should set programming for the whole project: “That’s where vibrancy is created, and that vibrancy is what drives traffic to everything above” (Urban Land, March 2026). Transition data tests that idea on your property.
Watch these transitions from the start:
- Office lobby to dining at lunchtime, showing whether weekday workers are eating on site.
- Parking-adjacent entries to the retail street, showing whether drivers walk the street or head to one destination.
- Plaza to retail and dining after events, showing whether programming sends people to tenants.
- Dining to retail in the evening, showing whether dinner guests extend their visit.
Journey mapping and heatmaps show where movement stalls. Our post on what WiFi heatmaps show goes deeper.
From a redevelopment we supported: A flagship Canadian retail and mixed-use property we work with was relocating a key tenant from its original entrance to a newly developed area. It used WiFi analytics to measure the traffic the tenant generated at its existing location and model how much would shift to the new zone, which helped the leasing team in conversations with prospective tenants. Read the tenant relocation case study.
Peak Hours by Zone and the Hybrid Office Week
Peak hours in a mixed-use district vary by zone, and the office week is one of the biggest drivers. Kastle Systems, which measures office occupancy from security card swipes, reported that in the week of December 8, 2025 its Back to Work Barometer reached a weekly average of 56.3% across all office buildings, with Tuesday hitting 66.0% (Kastle Systems, December 2025). Earlier that year, Bisnow reported Kastle data showing Tuesday occupancy at 63.4% and Friday at 36.7% (Bisnow, February 2025).
That midweek peak and Friday dip ripple outward. If your towers are quiet on Fridays, lunchtime dining will be too. Peak-hour data by zone lets you:
- Align restaurant and retail hours with demand in each zone.
- Schedule security, cleaning and maintenance around peak periods.
- Program Friday and weekend events to fill office-week gaps.
- Use peak-hour prediction and capacity trends to plan ahead.
See how peak-hour prediction works on the Aislelabs products page.
Measuring Placemaking and Event Impact
Placemaking metrics turn the public realm from a design intention into something you can report, and dwell time is usually the most telling one. In the same ULI discussion, BXP’s Rich Monopoli described focusing on “the ‘hardware,’ meaning the physical offerings, to the ‘software,’ which is the high-touch, five-star service” (Urban Land, March 2026). Dwell and movement data show whether people respond to both.
Useful placemaking metrics include:
- Plaza and park dwell time on weekdays versus weekends.
- Evening and weekend footfall in public space compared with office hours.
- Event lift, comparing footfall and dwell in the event zone and nearby dining against comparable days without programming.
- Post-event transitions, showing whether attendees move to retail and dining.
Compare a sunny Saturday concert with other Saturdays, not a rainy Tuesday. Over a season, that shows which programming earns its budget. Our guide to dwell time measurement covers the methodology.
Guest WiFi and Events for the Public Realm
A branded captive portal on the district’s public guest WiFi network builds a consented audience for events and promotions. This covers the public network in plazas, food halls and retail streets. Aislelabs doesn’t manage separate resident and office tenant networks.
A captive portal lets visitors sign in with email, social login, SMS and other methods, with consent capture that supports GDPR, CASL and CCPA. That list becomes the audience for event announcements, seasonal markets and tenant promotions. Sponsorship placements let tenants reach visitors, and native portal surveys ask what people want in the plaza next.
Visit-triggered email and SMS welcome first-time guests and reach lapsed guests. Connection-based reporting shows sign-ins, sessions and return visits among guests who log in.
Aislelabs for Mixed-Use Developments
Aislelabs offers three separate products, sold standalone or together.
- Aislelabs Flow AI measures footfall, dwell time by zone, visitor heatmaps, journey mapping and zone transition analytics, peak-hour prediction and capacity trends from the access points you already run, with multi-location benchmarking across a portfolio. Mixed-use districts have exactly the distinct retail, dining, public and lobby zones Flow is built to compare, within the areas your WiFi covers.
- Aislelabs Connect provides a fully branded captive portal on your public guest WiFi, with seven authentication methods, compliant consent capture, sponsorship placements, native portal surveys and Hotspot 2.0 and Passpoint.
- Aislelabs Marketing runs visit-triggered email and SMS, including first-visit welcomes and lapsed guest win-back, with campaign attribution to return visits. Aislelabs Marketing runs on the guest records Aislelabs Connect captures at the portal.
Aislelabs is ISO 27001:2022 certified, works with 14 WiFi hardware vendors and doesn’t alter your network. Explore each product on the Aislelabs products page.
Request a demo to explore how Aislelabs can transform your business with WiFi marketing and analytics.
FAQs About Mixed-Use Development Analytics
Mixed-use development analytics is the measurement of how visitors use and move between a district’s retail, dining, office and public spaces, focusing on zone footfall, dwell time, transitions and peak hours.
You measure mixed-use foot traffic by tracking visitor activity in each zone with WiFi analytics, camera-based counters or panel-based mobile location data. WiFi analytics covers the shared areas your access points reach.
The best placemaking metrics are dwell time in plazas and parks, evening and weekend footfall, event lift and post-event movement into retail and dining. Together they show whether public space is used and supports tenants.
By Zahid Rawat, Senior Marketing Manager at Aislelabs