TL;DR
- Period-over-period foot traffic analysis compares one date range against a reference range to show whether traffic, visits and dwell time went up or down, and by how much.
- The reference period you choose decides what the comparison can tell you: the previous period shows momentum, the same dates last year shows seasonality, and a custom period answers a specific question.
- Compare periods of equal length and similar makeup, because an extra weekend or holiday can create a change that has nothing to do with performance.
- Read devices, visits and dwell time together; a change in volume means something different when dwell time moves the same way, or doesn’t.
- WiFi foot traffic data measures detectable devices, not every person, so it’s strongest for trends and relative change rather than headcounts.
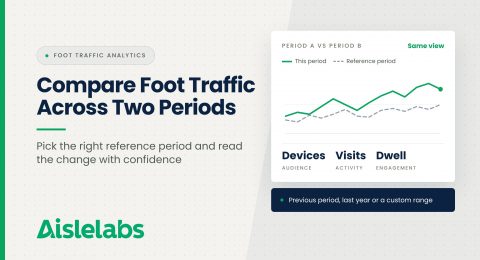
- Flow AI’s Comparison page puts two reporting periods in one view, with summary metrics and an overlaid daily trend, so you don’t have to combine separate reports by hand.
If you manage a busy venue, you probably need to compare foot traffic across two time periods every week, whether it’s this month against last month or this season against last year. It’s harder than it looks, because the answer depends almost entirely on what you compare against, and two honest analysts can reach opposite conclusions from the same data. Most bad conclusions about traffic come from a poorly chosen reference period, not from bad data. The good news is that a few simple rules make period-over-period comparison reliable. In this guide, you’ll find how to choose the right reference period, how to read devices, visits and dwell time together, how to interpret a trend overlay, and how to report the result with confidence.
What Is Period-Over-Period Foot Traffic Analysis?
Period-over-period foot traffic analysis compares a site’s traffic in one date range, Period A, against a reference date range, Period B, and reports the difference. The output is usually a set of headline metrics with their absolute and percentage change, plus a trend line for each period.
It answers the questions leadership asks most: Are we busier than last month? Did the renovation help? Without a structured comparison, teams export two reports and line them up in a spreadsheet, which is slow and error-prone.
For broader context on the metrics themselves, our ultimate guide to foot traffic analysis for retail stores covers the fundamentals, and you can see which Aislelabs products support location analytics.
Choose the Reference Period Before You Look at the Numbers
The reference period you choose determines what your comparison can tell you, so decide it based on your question, not on which comparison looks best. There are three main options, and each answers a different question.
Previous period compares against the period immediately before, such as this month against last month. Use it to track momentum and the short-term effect of a recent change, such as a new anchor tenant. Its weakness is seasonality.
Same dates last year compares against the equivalent dates twelve months earlier. Use it to separate real growth from seasonal swings. Its weakness is that layout, tenant or opening-hour changes over a year can make last year a less fair benchmark.
Custom reference period lets you choose any date range. Use it for targeted questions: an event weekend against an ordinary weekend, the month after a renovation against the month before, or a promotion week against a similar week without one.
From our October 2026 release: Flow AI now includes a Comparison page under Flow AI Insights that brings two reporting periods into one view. You can compare against the previous period, the same dates last year or a custom reference period. See the October 2026 product release.

Make the Two Periods Comparable
Two periods are only comparable when they match in length and in makeup, because differences in the calendar can create changes that look like performance.
Start with length: a 31-day month has an automatic head start over a 30-day month, so compare equal numbers of days.
Then check the makeup of each period. The number of weekends, public holidays, school breaks and major events inside each range matters as much as the dates. Official statisticians deal with the same problem: the U.S. Census Bureau adjusts its monthly retail figures for trading-day and holiday differences (U.S. Census Bureau) because the calendar alone moves the numbers.
Finally, note anything that changed at the venue, such as a closed wing or extended hours. For multi-location portfolios, apply the same rules at every site so comparisons stay consistent; our post on multi-site WiFi analytics covers that side.
Read Devices, Visits and Dwell Time Together
Devices, visits and dwell time each describe a different part of traffic, and reading them together tells you far more than any single number.
- Devices shows how many distinct devices were detected across the period, a guide to audience size.
- Visits shows how many visits those devices made, a guide to overall activity.
- Dwell time shows how long visits lasted, a guide to engagement.
The combinations are where insight lives. If devices and visits fall while dwell time holds steady, fewer people came but stayed just as long, which points toward reach rather than the experience inside. If volume holds steady but dwell time drops, the same number of people are spending less time on site, which points toward the experience: a closed amenity, fewer events or a change in tenant mix.
Look at absolute and percentage change together, since a small percentage on a large base can still mean a lot of visits.
How to Read a Trend Overlay Chart
A trend overlay chart plots both periods on the same axis so you can see where they diverge, and where they diverge tells you why the headline number moved.
Look for three patterns:
- A consistent gap. One line above the other on most days points to a broad, structural change.
- A few large gaps. Lines that track closely except on a handful of days mean events, closures or weather explain most of the change.
- A crossover. If the lines cross partway through, check what happened on that date.
A sudden single-day dip can mean a closure, or that a sensor stopped reporting. Our post on proactive sensor monitoring explains why checking sensor health first protects every comparison you make.
Remember What WiFi Foot Traffic Data Measures
WiFi foot traffic data measures devices detected by your access points, so it’s most reliable for trends, relative change and comparisons over time.
That’s why period-over-period analysis suits it well: when the same infrastructure measures both periods, the relative change is meaningful. Problems start when a comparison is presented as a headcount, or the infrastructure changed between periods. Our article on what foot traffic data does not tell you goes deeper on these limits.
Which Venues Get the Most From Period Comparisons?
Venues with multiple zones, large footprints or several locations get the most from period comparisons, because they have more moving parts that change between periods.
- Shopping centers and outlet malls comparing seasons, tenant changes and campaigns.
- Airports comparing travel peaks against ordinary weeks.
- Campuses, stadiums and convention centres comparing event periods against baseline periods.
- Multi-location portfolios comparing each site against its own history.
A single-room store doesn’t need zone mapping or heatmaps; connection reporting from the guest WiFi portal is usually the better fit there. The Aislelabs products page shows which option suits which venue.
How to Report a Period Comparison
A good period comparison report states the question, the two periods, the headline change and the most likely explanation in a few lines. For example: “September visits were below August, with the gap concentrated on weekdays when the east wing was closed for maintenance; weekends were in line with last month.”
Name the reference period, note anything unusual in either period, and show percentage and absolute changes together.
Compare Traffic Across Periods With Aislelabs Flow AI
Aislelabs Flow AI turns your existing WiFi access points into location analytics, with footfall, dwell time by zone, floor and venue, heatmaps, journey mapping, multi-location benchmarking and areas for grouping zones. The new Comparison page under Flow AI Insights brings two reporting periods into one view. You choose Period A and a reference period, whether the previous period, the same dates last year or a custom range, then see devices, visits and dwell time with their changes alongside an overlaid trend for both periods.
Historical comparisons depend on the data available for each site. Flow AI works with multiple WiFi hardware vendors, so you can use the infrastructure you already have. Explore the full lineup on the Aislelabs products page.
Request a demo to explore how Aislelabs can transform your business with WiFi marketing and analytics.
FAQs About Comparing Foot Traffic Across Two Periods
Choose a primary period and a reference period of equal length, then compare devices, visits and dwell time along with a trend line for each. In Flow AI, the Comparison page does this in one view.
Compare to last month to track momentum and short-term changes, and to the same dates last year to account for seasonality. Use a custom period when you’re testing a specific change, such as an event or renovation.
Month-over-month numbers often mislead because months differ in length, weekends, holidays and events. Compare equal-length periods with similar makeup, and note anything unusual in either period before drawing conclusions.
Devices counts the distinct devices detected in a period, while visits counts how many visits those devices made. Reading both, along with dwell time, shows whether a change came from audience size or activity.
A good reference period for an event is a similar period without the event, such as the same weekday and duration a week earlier. That isolates the event’s effect from normal weekly patterns.
By Zahid Rawat, Senior Marketing Manager at Aislelabs